Streamline-GEO©
Bathymetric Survey and Water Quality Mapping System

Bathymetric Survey and Water Quality Mapping System
|
Featured Products |
 NexSens CB-Series Buoys NexSens CB-Series Buoys
Available in a range of sizes, NexSens Data Buoys are designed for deployment in lakes, rivers, coastal waters, harbors, estuaries and other freshwater or marine environments. The buoys support both topside and subsurface environmental monitoring sensors including weather stations, wave sensors, thermistor strings, multi-parameter sondes, Doppler current profilers and other monitoring instruments. Request Information |
 PB200 Weather/Navigation System PB200 Weather/Navigation System
The PB200 WeatherStation by Airmar is an all-in-one marine sensor capable of providing navigation, heading and weather data for marine navigation systems, chartplotters and onboard computers! Request Information |
 X2-SDL Submersible Data Logger X2-SDL Submersible Data Logger
The X2-SDL Submersible Data Logger is a rugged, self-powered data logging and telemetry system for deploying environmental sensors in or near water without fear of accidental flooding. Request Information |
 M650H 4 Nautical Mile Solar Marine Light M650H 4 Nautical Mile Solar Marine Light
Solar marine light with 4 nautical mile range, 15 flashes per minute, yellow. Request Information |
|
Streamline-GEO© - Overview |
|
Streamline-GEO is a hydrographic and water quality mapping system that interfaces with NMEA GPS devices, YSI sondes, Airmar SmartSensors, and Turner Field Fluorometers (10-AU-005-CE) to create a unique environmental survey system. Streamline-GEO makes it easy to perform bathymetry surveys, outfall mapping (temperature, wastewater), dye studies, vertical profiles and 3D mapping in reservoirs, rivers, lakes and coastal regions.
Request Information |

|
|
|||||||||
|
Specifications
|
|||||||||
|
Downloads
|
|||||||||
|
Application
Mapping Water Quality and Bathymetry in Kaper Bay with Streamline-GEO
 Following the disastrous tsunami of 2004, Streamline GEO is playing a critical role in the hydrographic surveying and water quality mapping in coastal areas of Southern Thailand. Conducted by a field office supported by the United States Agency for International Development (USAID), the survey is part of the Post Tsunami Sustainable Coastal Program. The purpose of this program is to assist villages in recovery from the 2004 tsunami as well as implement disaster management plans in preparation for future emergencies. Because the topography of the coastline was so radically altered by the tidal wave, all survey data of the area taken prior to the event is erroneous, requiring new surveys to be conducted. Following the disastrous tsunami of 2004, Streamline GEO is playing a critical role in the hydrographic surveying and water quality mapping in coastal areas of Southern Thailand. Conducted by a field office supported by the United States Agency for International Development (USAID), the survey is part of the Post Tsunami Sustainable Coastal Program. The purpose of this program is to assist villages in recovery from the 2004 tsunami as well as implement disaster management plans in preparation for future emergencies. Because the topography of the coastline was so radically altered by the tidal wave, all survey data of the area taken prior to the event is erroneous, requiring new surveys to be conducted.
To illustrate Streamline-GEO's versatility, the application presented here details how a coastal tributary (5 mile survey path) was surveyed in a less than 3 hours! A pole mount was constructed and attached to the kayak to hold the transducer, GPS and sonde (Figure 1). The operator followed a survey path that zigzagged from shore to shore as he made his way upstream and covered a linear distance of approximately 5 miles. Streamline-GEO automatically acquired data from the echo sounder, sonde and GPS and displayed the data, scaled by color, on the GIS map. The vessel location and survey track are also displayed on the GIS map. A status board shows the instantaneous water depth, geographic position, vessel speed and heading along with Quality Indicators for each parameter. Following the survey, the data was viewed in the GIS to confirm that the automated QA/QC process removed spatial outliers. As a secondary QA/QC verification, the data sets were examined in Analyst to verify that invalid data had been properly flagged. The data sets were then exported directly to an Excel file using the Streamline's Batch Export Module and processed using a surface and contour analysis plotting application. the results of the survey are shown in the figures below. Bathymetry data collected during the Kaper Bay survey is represented in the first two figures and water temperature in the last figure. In the first figure the data is shown as a color scaled contour map overlayed on a geo-referenced satellite image of the survey area. A 3-dimensional color-coded representation of the hydrography is shown in the second figure. The hydrographic data is used in flooding models to enhance disaster management and evacuation planning.  
Water temperature data collected with the sonde is represented in the figure below as a color scaled contour map with the geo-referenced image in the background. Water temperatures are warmest water near the coastal area and decrease steadily moving upstream in the tributary. Additional analysis of environmental measurement collected with the 600XL sonde (salinity, pH and dissolved oxygen) were also performed by staff from the field office. Data from this survey is combined with data collected in coastal and offshore waters using larger motorized vessels. 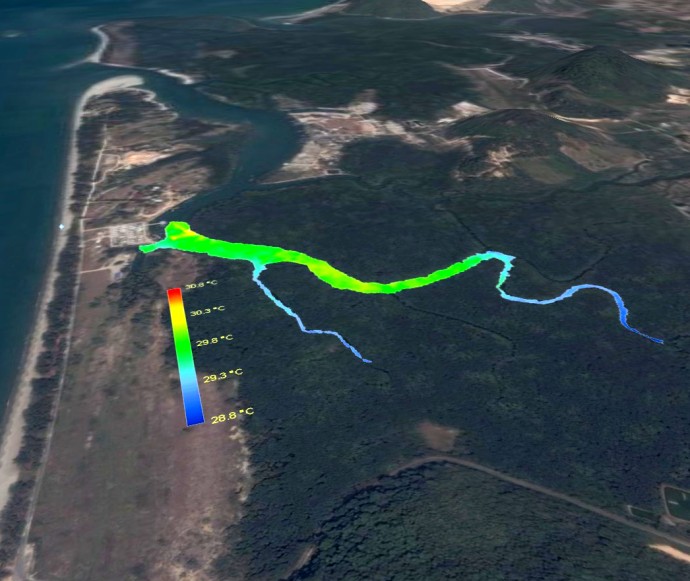
|
|||||||||
©Copyright 1999-2025 Interactive Oceanographics